Anomalies in Gino, Kouchaki, Galinsky 2015
Study 4
The five studies of the paper can be found on the OSF. We only focus on study 4 because it presents the strongest anomalies.
In study 4, the authors manipulate three conditions:
high-choice, counter-attitudinal
low-choice, counter-attitudinal
high-choice, pro-attitudinal.
To do so, they ask participants to write a counter- or pro-attitudinal essay about a certain topic, and let some participants, but not others, choose whether they wanted to write a counter-attitudinal essay.
They hypothesize that, since writing a counter-attitudinal essay is inconsistent with participants’ internal beliefs, participants would have a greater desire for cleanliness, regardless of their choice level.
Dependent Variable: Desirability of Cleansing Products: Participants indicated how desirable they found a list of cleansing products (Dove shower soap, Crest toothpaste, Windex cleaner, Tide detergent, Lysol disinfectant) on a 7-point scale (from 1, completely undesirable, to 7, completely desirable). Authors then computed the average of responses on the five cleansing products.
library(tidyverse)
library(ggplot2)
library(ggforce)
library(ggbeeswarm)
Strange Streak of Responses in the End of the Data
When plotting the average response to the Desire for Cleansing Products scale, a strange pattern emerges: The majority of the participants who rate all cleansing products at “7” are found at the end of the data (marked in red).
data <- read.csv("experiment4.csv")
data <- data %>% drop_na()

ggplot(data, aes(X, av_products_clean)) +
  geom_point(colour = "blue", size = 1) +
  labs(x = "Observation ID", y = "Desirability of cleansing-related products") +
  scale_y_continuous(limits = c(1, 7), breaks = c(1, 2, 3, 4, 5, 6, 7)) +
  geom_mark_ellipse(data = data %>%
                    filter(X > 440 & av_products_clean == 7),colour = "red",
                    expand = unit(1, "mm")) +
  theme_bw()
In particular, we observe several sequences of consecutive “7” that we never see elsewhere in the data, including one of length 4 (i.e., “7, 7, 7, 7”).
7 is a rare value, observed in only about 6% of responses (28 over 490 responses). What are the odds of seeing a sequence of four “7” in the data?
To answer this question, we can shuffle the vector of observations a large number of times, and observe in each shuffle the longest sequence of consecutive “7”.
max_cons_value <- function(x, val) { # Function to compute longest streak of `val`
  y <- rle(x) # Rfunction rle for "run length encoding" (https://www.r-bloggers.com/2009/09/r-function-of-the-day-rle-2/)
  len <- y$lengths[y$value == val]
  max(len)
}

# Longest streaks observed in real data
max <- max_cons_value(data$av_products_clean, 7)

response <- data %>%
  pull(av_products_clean)

# Empty vectors to store shuffled results
outcome <- c()

nboots <- 100000

# Repeated shuffles
for (i in 1:nboots) {
  shuff <- sample(response) # Shuffle responses
  maxseq <- max_cons_value(shuff, 7) # Longest sequence of sevens in shuffled vector
  outcome <- append(outcome, maxseq) # Store it
}

df <- as.data.frame(outcome)

dfnew <- df %>% group_by(outcome) %>% count()

ggplot(df, aes(x = outcome, y = ..prop..)) +
  geom_bar(stat = "count", fill="lightblue", width=0.7) +
  scale_x_discrete(name ="Longest stretches of 7",
                    limits=c("1","2", "3", "4", "5", "6")) +
  labs(y = "Proportions") +
  geom_vline(xintercept = 4, linetype="dashed",
                color = "red", size=1) +
  theme_classic()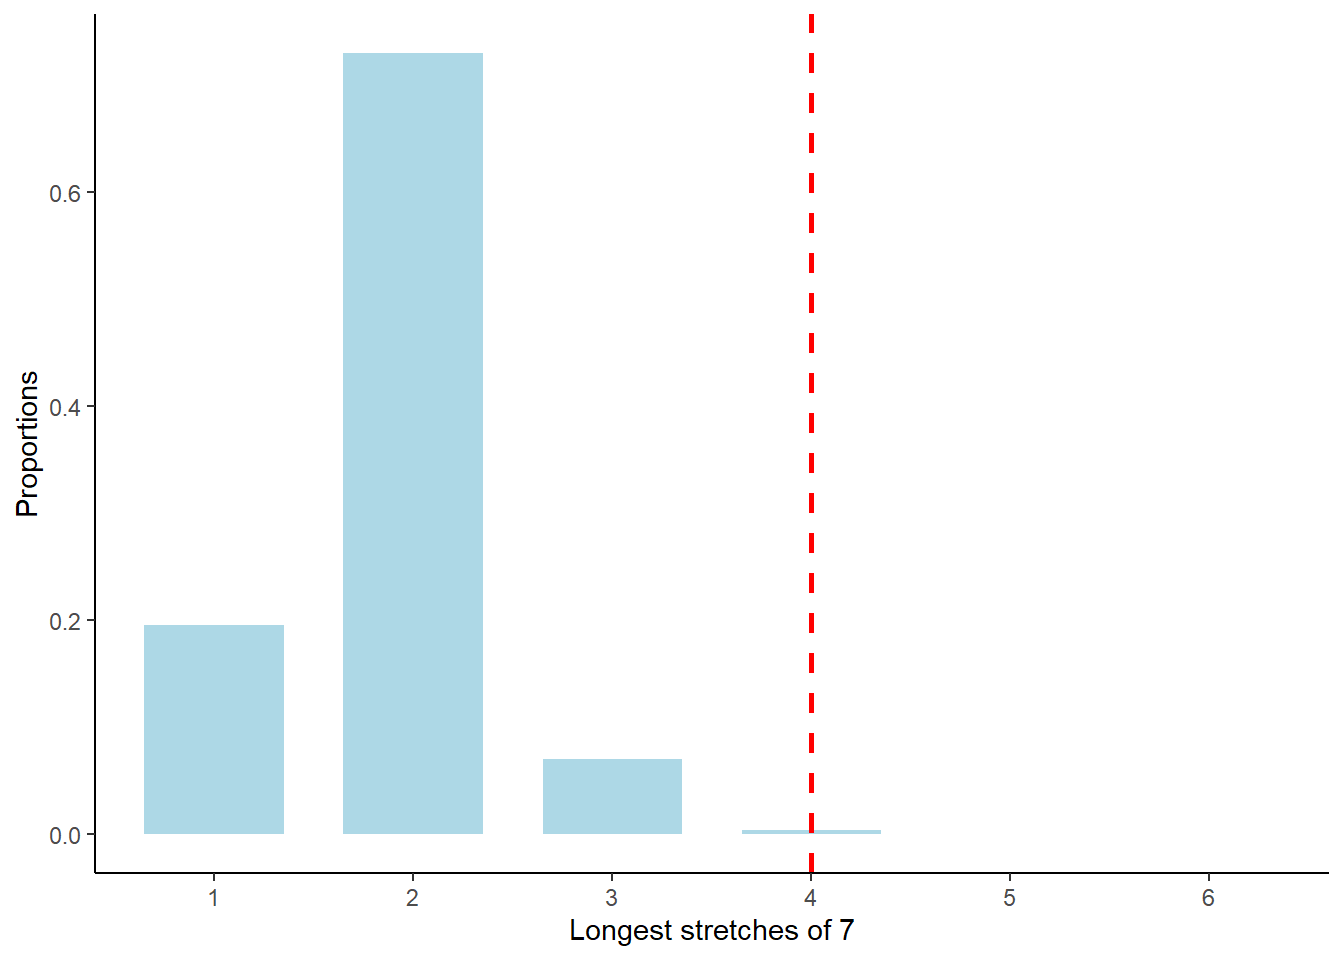
The simulation confirms that four or more consecutive “7” are rare: They are observed less than 0.5% of the time.
Strange Responses among Participants who Responded “7” in the End of the Data
A closer look at the participants answering “7” in the end of the data reveals an even stranger pattern:
data[data$av_products_clean == 7 & data$X > 440,] %>% select(age, male, yearSchool, condition, av_products_clean)## age male yearSchool condition av_products_clean
## 448 23 0 harvard No_Choice 7
## 452 25 0 Harvard High_Choice 7
## 454 22 1 Harvard ProAttitudinal 7
## 455 24 0 Harvard High_Choice 7
## 456 22 0 Harvard High_Choice 7
## 457 25 0 Harvard No_Choice 7
## 459 25 0 Harvard High_Choice 7
## 461 24 0 Harvard No_Choice 7
## 472 25 0 Harvard High_Choice 7
## 473 22 1 Harvard No_Choice 7
## 474 23 1 Harvard High_Choice 7
## 476 26 1 Harvard No_Choice 7
## 479 24 1 Harvard High_Choice 7
## 481 25 1 Harvard High_Choice 7
## 482 27 0 Harvard No_Choice 7
## 488 22 1 2014 No_Choice 7All participants but one wrote down “Harvard” for the question asking them to indicate their current year in school. It is surprising that so many participants make the same mistake, unless it is a very common mistake.
How many participants made a similar mistake in the rest of the data? Zero.
When we “tag” the participants who answered “Harvard” in the data, we see that their responses follow a specific pattern:
data <- data %>% mutate(WroteHarvard = ifelse(yearSchool == "Harvard" | yearSchool == "harvard", 1, 0))

data$WroteHarvard <- as.character(data$WroteHarvard)
data$condition <- factor(data$condition, levels=c("High_Choice", "ProAttitudinal", "No_Choice"))

ggplot(data = data, aes(x = condition, y = av_products_clean, col = WroteHarvard)) +
  geom_beeswarm() +
  theme_bw() +
  ggtitle("Study 4") +
  labs(
    x = "Conditions",
    y = "Desirability of Cleansing Products"
  ) +
  scale_x_discrete(labels = c("High_Choice" = "Counter-attitudinal (chosen)",
                              "ProAttitudinal" = "Pro-attitudinal",
                              "No_Choice" = "Counter-attitudinal (no choice)"),
                   limits = levels(data$condition)) +
  scale_y_continuous(breaks = seq(1, 7, 1), minor_breaks = NULL) +
  scale_colour_manual(name = "Replied Harvard?", values = c("dodgerblue1", "orangered1")) +
  theme(
      plot.title = element_text(hjust = 0.5, size = 12, face = "bold"),
      axis.title.x = element_text(size = 10, face = "bold"), axis.text.x =
        element_text(size = 8),
      axis.title.y = element_text(size = 10, face = "bold"), axis.text.y =
        element_text(size = 8),
      legend.title = element_text(size = 10, face = "bold"), legend.text =
        element_text(size = 8)
      )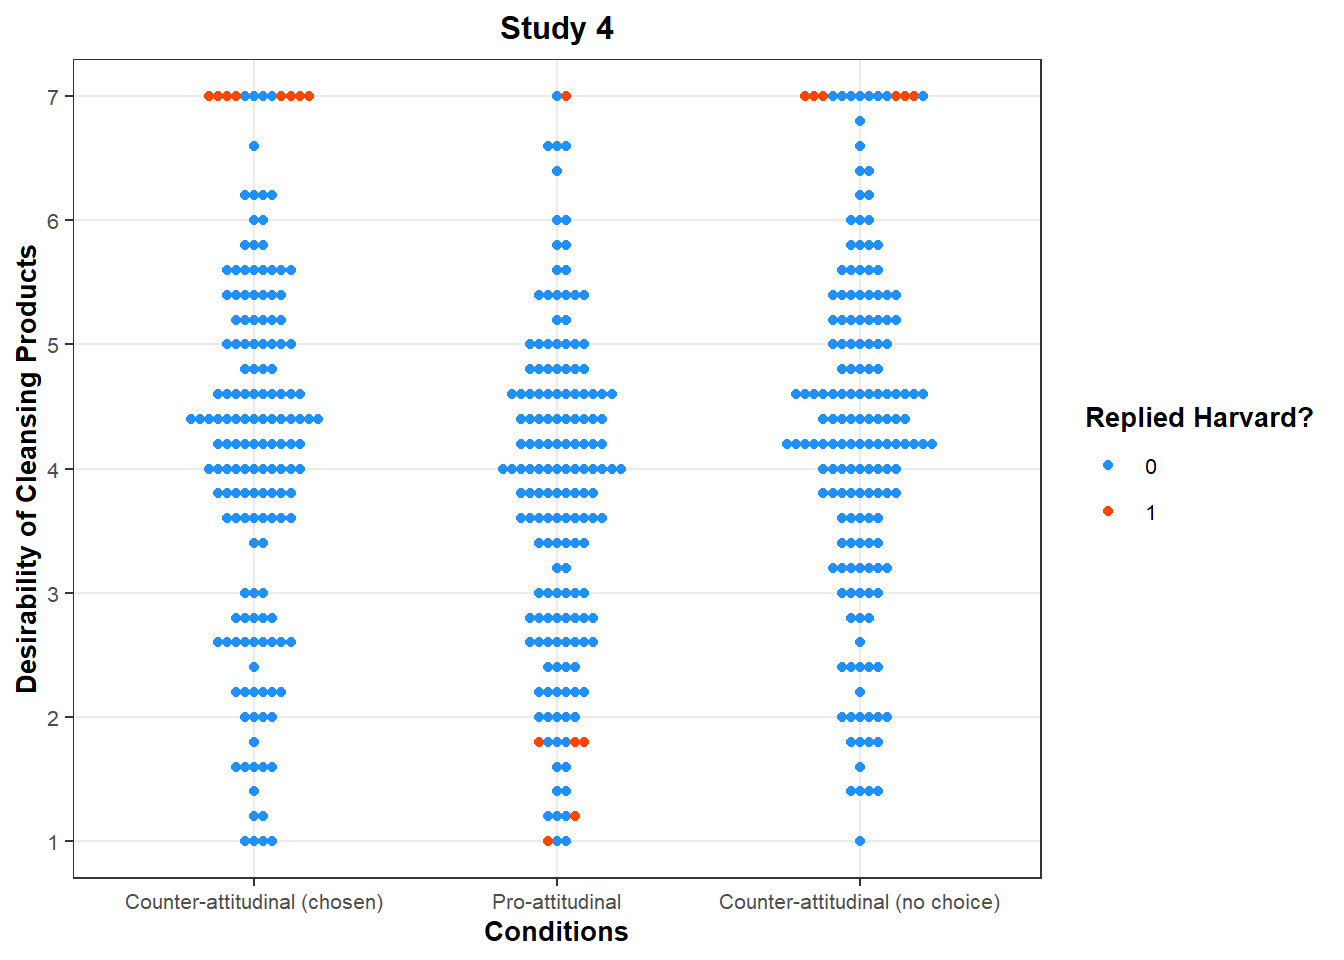
It is an extraordinary coincidence that the 20 students who made a mistake by answering Harvard to a question that was asking them in which year they were, have a desire for cleansing products that perfectly matches the authors’ hypotheses:
In both counter-attitudinal conditions, they have the highest score (7) on the Desirability for Cleansing Products scale.
In the pro-attitudinal condition, all but one student have a score below 2 on this same scale.
If it was a real mistake, the answers of these 20 students should not be so strongly predicted by the experimental condition they were assigned to.
subset <- data %>% filter(WroteHarvard == 1)
subset <- subset %>% mutate(new_cond = ifelse(condition == "ProAttitudinal", "pro", "counter"))

t.test(av_products_clean ~ new_cond, data = subset)
##
## Welch Two Sample t-test
##
## data: av_products_clean by new_cond
## t = 4.9403, df = 5, p-value = 0.004321
## alternative hypothesis: true difference in means between group counter and group pro is not equal to 0
## 95 percent confidence interval:
## 2.190519 6.942814
## sample estimates:
## mean in group counter mean in group pro
## 7.000000 2.433333The difference between the Pro-Attitudinal and Counter-attitudinal conditions for just these 20 observations is significant (p < .01).
Zoé Ziani
PhD in Organizational Behavior