Analyze your Data based on your Hypothesis, not on how the Variables are Coded

Research Question
Let’s say that you’re a manager in a company. You have noticed that women within the organization network differently than men. Your intuition is that women network less efficiently than men because they renounce some networking actions for fear of being misjudged.
More precisely, you would like to test whether women are less likely than men to become friends with a supervisor of the opposite gender. You indeed expect that women might fear for their reputation when they are getting closer (something that researchers call “network-deepening actions”) to a male supervisor, because of a stereotype painting women as able and willing to use their power of attraction to influence men of power (the stereotype of the “seductress” or “temptress”).
Data Analysis
To test this hypothesis, you asked employees in your company how likely they would be to engage in network-deepening actions with a supervisor. In your survey, you randomly assigned respondents to consider a male (vs. a female) supervisor, and asked them to report how likely they would be to become friends with this person.
The “natural” impulse when analyzing this data would be to regress the variable of interest (the likelihood to engage in network-deepening actions with the supervisor) on the variables of the survey (the gender of the supervisor, the gender of the respondent, and the interaction between these two variables).
In one of my research projects, I actually ran an experiment testing this hypothesis. Let’s see what the data looks like using this analysis:
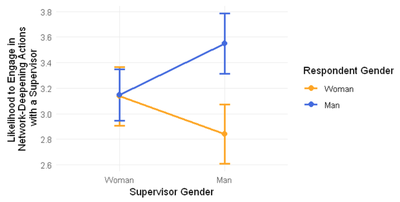
If we plot the data like described, the hypothesis seems, at first glance, supported: When the gender of the supervisor changes from woman to man (x-axis), women (in orange) become less likely to engage in network-deepening actions, and men (in blue) become more likely to engage in network-deepening actions.
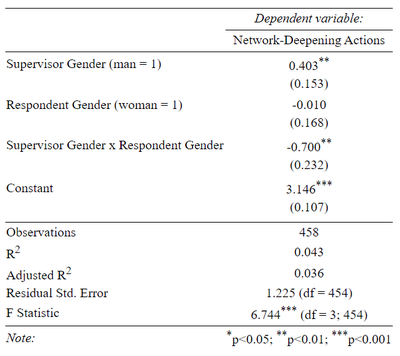
This interpretation is confirmed by the interaction term in the regression: -0.7 significant at p < .01
From this result, we might conclude that our hypothesis is supported… But is it?
Let’s look at what the interaction term represents here.
| Respondent_Gender | Supervisor_Gender | Network_Deepening_Actions |
|---|---|---|
| Man | Woman | 3.146 |
| Man | Man | 3.549 |
| Woman | Woman | 3.136 |
| Woman | Man | 2.839 |
The interaction term is a difference of difference. In the present case, it compares the likelihood for women to become friends with a male (vs. female) supervisor to the likelihood for men to become friends with a male (vs. female) supervisor:
((Male Supervisor - Female Supervisor) when the Respondent is a Woman) - ((Male Supervisor - Female Supervisor) when the Respondent is a Man)
==> ((2.839 - 3.136) - (3.549 - 3.146)) = -0.297 - 0.403 = -0.7
The problem with this interaction term is that it captures something we are not actually interested in: Preference for homophily (here, the fact that people prefer interacting with other people from the same gender). Indeed:
- Women are less likely to engage in network-deepening actions with a male (rather than female) supervisor.
- Similarly, men are less likely to engage in network-deepening actions with a female (rather than male) supervisor.
However, this is not the question we were interested in: We wanted to know whether this preference for gender homophily is stronger for women than for men. In other words, we want to know whether women are less likely than men to engage in network-deepening actions with a supervisor of the opposite (rather than same) gender.
To make this comparison, we need to go beyond the variables in our data, and create a new variable that encodes whether the respondent and the supervisor have the same gender.
| Respondent_Gender | Supervisor_Gender | Network_Deepening_Actions | Gender_Similarity |
|---|---|---|---|
| Man | Woman | 3.146 | diff |
| Man | Man | 3.549 | same |
| Woman | Woman | 3.136 | same |
| Woman | Man | 2.839 | diff |
The comparison of interest is the following:
((Supervisor of Different Gender - Supervisor of Same Gender) when the Respondent is a Woman) - ((Supervisor of Different Gender - Supervisor of Same Gender) when the Respondent is a Man)
==> ((2.839 - 3.136) - (3.146 - 3.549)) = -0.297 - (-0.403) = 0.105
If we re-run our original analysis using this variable instead, here is what we find:
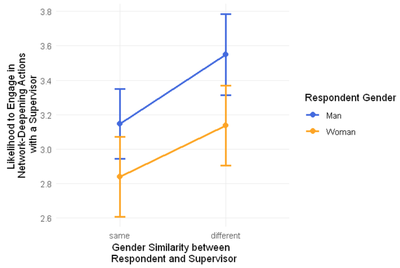
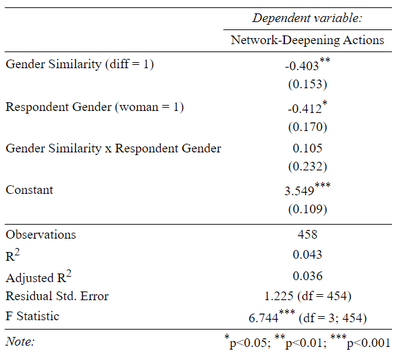
The nice “fan-shaped” pattern that we had before is gone, and we now see two parallel lines, and a non-significant interaction term (0.10 at p > .05). It suggests that while men are less likely to become friends with women, and women are less likely to become friends with men, they do not differ in the strength of this preference: We do not observe a specific reluctance from women to develop stronger relationships with supervisors of the opposite gender.
Conclusion
From the same experiment, we got two different results. Why? Because there are often different ways to analyze an experiment, and the way you analyze those results should depend on the hypothesis, not on the way your data is coded.
Only the hypothesis tells you which analysis is valid. The experimental variables alone are meaningless.
- In the first analysis, we compared how likely women (vs. men) would be to network with a male (vs. female) supervisor. What we observed is that while women prefer interacting with other women, men prefer interacting with other men. These results reflect preference for homophily: People have a natural tendency to primarily interact with people who share common attributes with them, because it facilitates communication, favors reciprocity and trust. If your hypothesis was to test for this pattern, then the first analysis is the correct analysis, and it is supported.
- In the second analysis, we compared how likely women (vs. men) would be to network with a supervisor of the opposite (vs. same) gender. What we observed is that there is no difference between men and women: Women are not more reluctant than men to engage in network-deepening actions with a supervisor of the opposite gender, they both tend to avoid this type of networking action. If your hypothesis was to test for a specific reluctance of women to engage in this networking action, then the second analysis is the correct analysis, and it is not supported.
Zoé Ziani
PhD in Organizational Behavior